


n the final installment of Andrea Jengle’s three-part series on measuring body composition, she commented that, “Progress is never linear…”. In this article I test that premise and give you an example of how it is TRUE.
First, some background. For the past several months I have been working on body recomposition: attempting to lose body fat while simultaneously building lean mass. My objective, in fact, was not necessarily weight loss, but replacing fat weight with muscle weight. It was a little more challenging than just losing weight because it required weekly measuring and tracking of changes in fat mass as well as changes in fat free mass[1].
As a man of 60, it was crucial for me to do this. Fairly recent research has demonstrated that loss of lean mass as measured by the fat free mass index (FFMI) is a better predictor of early mortality among older men than BMI[2,3]. For older men, it appears that weight loss without protection of lean muscle leads to an early grave. I had to therefore protect my lean fat free mass as I worked to shed the fat.
Looking at my data, it dawned on me that I could test if my change in body composition followed a linear trend or not using mathematical modeling. Mathematical modeling has been applied to test the linear relationship between a number of physiological and metabolic processes associated with fat free mass such as resting energy expenditure[4], energy balance[5], and modeling the body’s ability to create fat free mass[6].
The test is relatively simple: If my body composition change was linear, it would hug a straight line. If the change was nonlinear (i.e., not a straight line), my body composition change would better follow one of a number of different curved trends[7]. The point of this model testing was not to predict the future (something this type of modeling does not do well[8]), but to mathematically model what happened.
Originally, Body IO® coach, Alex Navarro, worked out a plan of attack for me. Her plan included a Body IO program of ultra-low carb diet focusing on healthy fats and protein[9], Carb Backloading™, and Carb Nite®. My plan also included full body weight training three days per week[10], occasional walking back and forth to the gym, and Carb Shock™ in my post-workout protein shake. I tracked my macronutrient levels and weight daily using the FitNow LoseIt app and weight-training using the JEFIT workout tracker.
Every week I estimated my body fat percentage using skinfold calipers, taking the average of three measures on three sites and estimated my percent body fat by entering my skinfold average measurements into the VoicheBody Fat calculator. Andrea’s criticism of skinfold calipers is certainly justified[11]. But many researchers have found them acceptable measures of body fat[12-14] and they’re certainly useful for tracking change. Alex also took caliper measurements and validated my levels. I entered my estimates of fat free mass and fat mass into an Excel spreadsheet after each measurement. I stuck to this program pretty religiously (I’d rate my adherence to the program at 90% or better).
Starting at 23% body fat, it took me sixteen weeks to reach 15%. I had no overall weight change: My average weight for the sixteen weeks was 249.9 lbs, plus or minus 1.6 lbs. My estimated fat free mass and fat mass at the beginning were 190 lbs. and 59 lbs, respectively. On the sixteenth week my estimated fat free mass was 211 lbs and fat mass was 37 lbs. Over the sixteen weeks I dropped about 1.4 lbs of fat mass per week and gained about the same in fat free mass.
But, what about the progress? Was it linear (approximating a straight line) or not linear (following some kind of curve)?
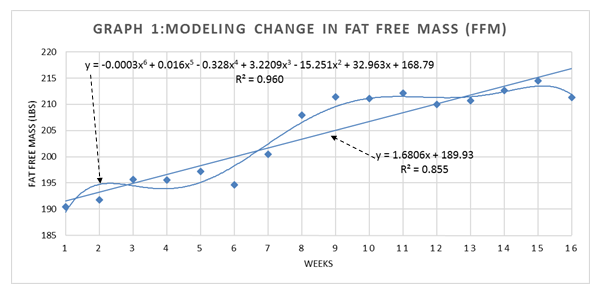
My actual tracking data levels for fat free mass change is shown in Graph 1. My fat mass change is shown in Graph 2. The measure of predictive fit is the R-squared (R2) value. The higher the R2 the better the fit.
Relative to fat free mass, the straight line (linear) model reached an R2 of about 0.86. Not bad. I tested different curved line models and found the wavy (polynomial) shape to be the best: It reached an R2 of 0.95. It also matched what actually happened better than the straight line. The equation for the wavy line prediction was much more complex than the equation for the straight line prediction.
The same was true, to a slightly lesser extent, for change in fat mass. The straight line prediction reached an R2 of about 0.92; the wavy line (polynomial) prediction was somewhat better at R2 of about 0.97, again associated with a much more complex equation.
In my case, Andrea was certainly right. My progress was not linear and better explained by a curved (nonlinear) trend versus a straight line. This was true for both fat loss and lean mass gain.

There are a number of important takeaways from this look at my body recomposition process. First, both my fat loss and lean mass gains are better described by a nonlinear trend. The equations that best fit the data for both underscore this.
Second, the equations that best describe the change process trace out a trend characterized by periods of relatively rapid progress as well as periods where progress seemed stalled, sometimes lasting for weeks. This fact underscores the mistake of judging body recomposition progress by day, by week, or by month. How many people have given up their diet after a few weeks of no or slow progress, and so failed to reach the periods of rapid progress?
Third, the length of the nonlinear process of body recomposition extends over months. You can’t see it by looking week by week or even over several weeks. This is certainly a downside. Many people quit without frequent positive reinforcement. The positive side, however, and the greatest plus in my opinion–is the stability it left behind. Having reached my goal slowly, it allowed me time to form new habits and to get them firmly in place. I am now much less likely to rebound. That’s good.
It is important to keep in mind that my results were a response to the interaction of my diet, physical activity, and adherence to both. Someone using just diet or just physical activity might not produce trends similar to mine. The trends of fat free mass or fat loss change might extend over longer periods. A person’s consistency would also certainly make a difference.
I’ll close by saying thank you to my daughter, Alex Navarro. I can’t say enough about the benefit of her guidance. And, of course, thank you to Kiefer for making available the great tool box of Body IO weight loss and muscle support products. There is no doubt they got the job done.
I have often heard people say, “Fat loss is a rollercoaster.” Looking at my graphs, I can’t help but think —ain’t it the truth, ain’t it the truth.
[expand title=”References (click to expand)”]
- Lukaski, H. C., Johnson, P. E., Bolonchuk, W. W., & Lykken, G. I. Assessment of fat-free mass using bioelectrical impedance measurements of the human body. The American Journal of Clinical Nutrition, 1985; 41(4), 810-817.
- Han, S. S., Kim, K. W., Kim, K. I., Na, K. Y., Chae, D. W., Kim, S., & Chin, H. J. Lean mass index: a better predictor of mortality than body mass index in elderly Asians. Journal of the American Geriatrics Society, 2010; 58(2), 312-317.
- Chuang, S. Y., Chang, H. Y., Lee, M. S., Chen, R. C. Y., & Pan, W. H. Skeletal muscle mass and risk of death in an elderly population. Nutrition, Metabolism and Cardiovascular Diseases, 2014; 24(7), 784-791.
- Wang, Z., Heshka, S., Gallagher, D., Boozer, C. N., Kotler, D. P., & Heymsfield, S. B. Resting energy expenditure-fat-free mass relationship: new insights provided by body composition modeling. American Journal of Physiology-Endocrinology and Metabolism, 2010; 279(3), E539-E545.
- Thomas, D., Das, S. K., Levine, J. A., Martin, C. K., Mayer, L., McDougall, A., … & Heymsfield, S. B. Research New fat free mass-fat mass model for use in physiological energy balance equations. Nutrition & Metabolism, 2010; 7:39.
- Mingrone, G., Marino, S., DeGaetano, A., Capristo, E., Heymsfield, S. B., Gasbarrini, G., & Greco, A. V. Different limit to the body’s ability of increasing fat-free mass. Metabolism, 2001; 50(9), 1004-1007.
- Graphs: Types, Examples & Functions. https://study.com/academy/lesson/graphs-types-examples-functions.html
- Brandt, A. R. Review of mathematical models of future oil supply: Historical overview and synthesizing critique. Energy, 2010; 35(9), 3958-3974.
- Herda, A. A., Herda, T. J., Costa, P. B., Ryan, E. D., Stout, J. R., & Cramer, J. T. Muscle performance, size, and safety responses after eight weeks of resistance training and protein supplementation: a randomized, double-blinded, placebo-controlled clinical trial. The Journal of Strength & Conditioning Research, 2013; 27(11), 3091-3100.
- Schoenfeld, B. J., Ratamess, N. A., Peterson, M. D., Contreras, B., & Tiryaki-Sonmez, G. Influence of resistance training frequency on muscular adaptations in well-trained men. Journal of Strength and Conditioning Research, 2015; 29(7):1821-1829.
- Jengle, A. Measuring Body Composition and Progress – Part 1 – Options. https://body.io/measuring-body-composition-progress-part-1-options/
- Narayani, U., & Sudhan, P. R. Effect of aerobic training on percentage of body fat, total cholesterol and HDL-C among obese women. World Journal of Sport Science, 2010; 3(1), 33-36.
- Padilla-Moledo, C., Castro-Piñero, J., Ortega, F. B., Mora, J., Márquez, S., Sjöström, M., & Ruiz, J. R. Positive health, cardiorespiratory fitness and fatness in children and adolescents. The European Journal of Public Health, 2011; ckr005.
- Sicotte, M., Ledoux, M., Zunzunegui, M. V., Aboubacrine, S. A., & Nguyen, V. K. Reliability of anthropometric measures in a longitudinal cohort of patients initiating ART in West Africa. BMC Medical Research Methodology, 2010; 10(1), 102.
[/expand]


